Predictive Port Congestion Analytics: How Real-Time Data Is Reducing Dwell Times in 2026
Port congestion has long been the silent margin killer in global logistics. In 2025 alone, the average container dwell time at the world's top 20 ports exceeded 5.2 days — costing shippers an estimated $24 billion in demurrage fees, missed delivery windows, and cascading supply chain disruptions. But 2026 is marking a turning point. Predictive port congestion analytics, powered by real-time data feeds and machine learning models, are enabling logistics operators to see congestion before it happens — and route around it.
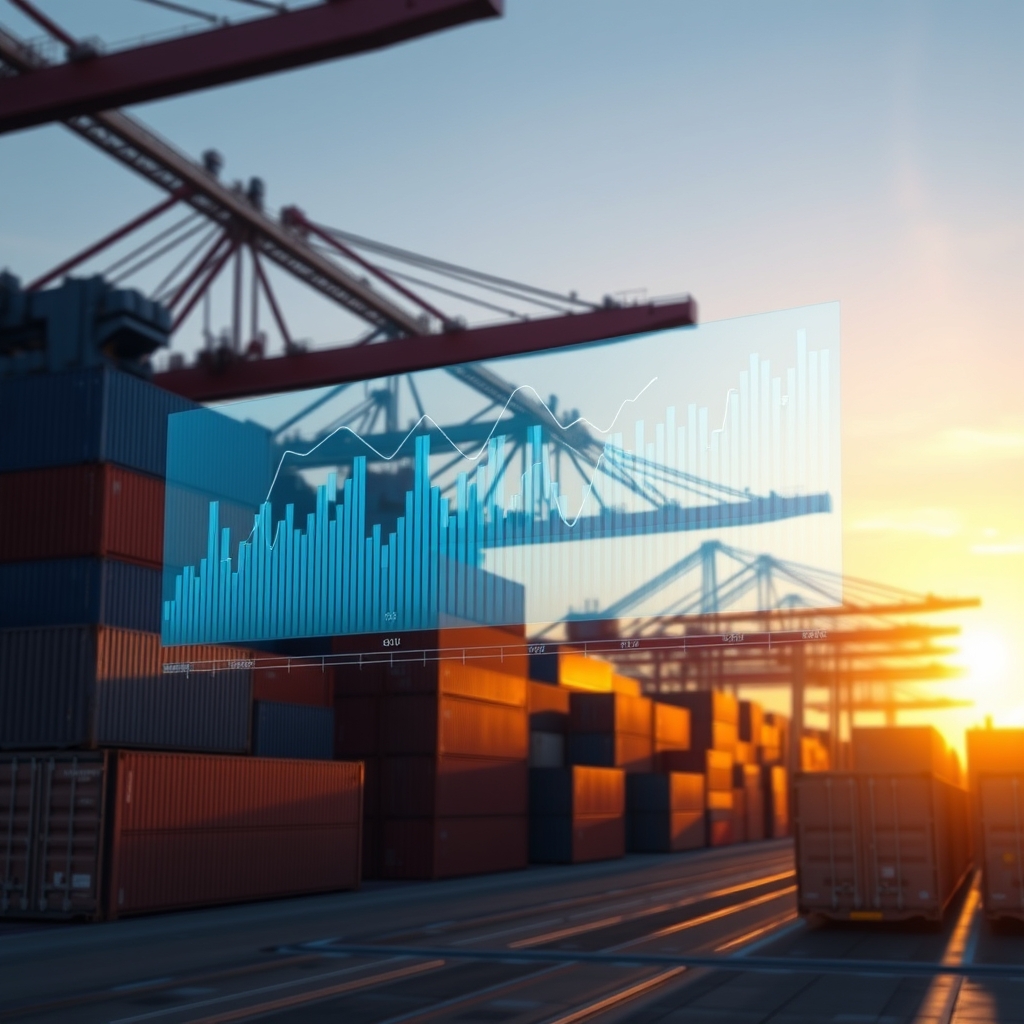
This isn't theoretical. Major ports from Rotterdam to Shanghai are already deploying these systems, and early adopters are reporting dwell time reductions of 25–35%. Here's how the technology works, who's leading the charge, and how shippers can leverage these tools today.
The Anatomy of Port Congestion in 2026
Port congestion isn't a single event — it's a compounding cascade. A labor shortage at one terminal creates a backlog that ripples into berth availability, which delays vessel discharge, which pushes truck appointments, which overwhelms inland depots. Traditional approaches relied on lagging indicators: once you saw the congestion, you were already in it.
Key Congestion Drivers This Year
- Vessel mega-sizing: The average container ship capacity has grown 18% since 2023, concentrating more cargo into fewer port calls
- Labor market tightness: Crane operator shortages persist at 12 of the world's top 25 ports
- Weather volatility: Climate-related port closures increased 40% year-over-year
- Geopolitical rerouting: Ongoing Red Sea diversions continue adding 10–14 days to Asia-Europe transit times
📊 By the Numbers
The Port of Los Angeles reported that predictive analytics reduced average truck turn times from 87 minutes to 54 minutes in Q1 2026 — a 38% improvement that translates to roughly $180 per container in savings for drayage operators.
How Predictive Analytics Actually Works
Modern port congestion prediction combines multiple real-time data streams into a unified model that forecasts congestion 48–72 hours in advance. The core data inputs include:
- AIS vessel tracking: Real-time ship positions, speeds, and ETAs from satellite and terrestrial receivers
- Terminal operating system (TOS) feeds: Berth schedules, crane assignments, and yard density metrics
- Truck appointment systems: Gate transaction volumes and appointment compliance rates
- Weather and tide data: Wind speeds, visibility, and tidal windows that affect vessel maneuvering
- Historical patterns: Seasonal trends, day-of-week effects, and holiday surge modeling
Machine Learning Models in Production
The most effective systems use ensemble models — combining gradient-boosted trees for short-term predictions (24–48 hours) with recurrent neural networks for longer-horizon forecasting (1–2 weeks). These models are trained on years of historical port operations data and retrained weekly as conditions evolve.
What makes 2026 different from earlier attempts is data granularity. Five years ago, you might get port-level congestion scores updated daily. Today, platforms like FreightPulse deliver terminal-level, gate-level, and even berth-level congestion predictions updated every 15 minutes.
Real-World Impact: Case Studies
Rotterdam's Digital Twin Port
The Port of Rotterdam's Pronto platform, now in its third generation, uses a digital twin of the entire port to simulate vessel arrivals up to 5 days out. In 2026, participating carriers have reduced idle time at anchorage by 31%, saving an estimated €2.1 million per month in fuel costs alone. The system processes over 12 million data points daily from 45 different sources.
Singapore's CALISTA 2.0
Singapore's next-generation port community system integrates customs clearance predictions with berth availability forecasting. Containers that would previously sit for 3–4 days waiting for documentation clearance are now pre-cleared before the vessel arrives. The result: a 28% reduction in average dwell time for participating shippers.
💡 Key Insight
The biggest ROI from predictive port analytics doesn't come from avoiding congestion entirely — it comes from knowing about it early enough to adjust. Even a 24-hour advance warning lets shippers rebook drayage, adjust warehouse receiving schedules, and notify customers before delays compound.
How Shippers Can Start Using Predictive Port Data
You don't need to build your own models. The predictive port analytics ecosystem has matured significantly, and several approaches are available depending on your volume and technical capacity:
- API-first platforms: Services like FreightPulse provide port congestion scores and dwell time predictions via REST APIs that integrate directly into your TMS or visibility platform
- Port community systems: Many major ports now offer their own congestion dashboards with varying levels of API access
- Carrier visibility tools: Major ocean carriers including Maersk, MSC, and CMA CGM now embed port congestion predictions in their booking platforms
- Custom models: For high-volume shippers (10,000+ TEUs/year), building proprietary models on top of raw data feeds can provide competitive advantage
Integration Best Practices
The most successful implementations we've seen follow a three-phase approach:
- Phase 1 — Visibility: Start by consuming congestion data as a dashboard or alert feed. Get your ops team used to having forward-looking port intelligence.
- Phase 2 — Automation: Integrate congestion predictions into your TMS to automatically flag at-risk shipments and suggest alternative routing.
- Phase 3 — Optimization: Use predictive data to inform carrier selection, booking timing, and contract negotiations. Shippers who book during predicted low-congestion windows save 8–12% on drayage costs.
What's Coming Next: The 2026–2027 Horizon
Several emerging developments will make predictive port analytics even more powerful in the coming year:
- Port-to-port corridor modeling: Instead of analyzing individual ports in isolation, new models will predict congestion cascades across entire trade lanes
- Carbon-aware routing: Congestion predictions are being combined with emissions data to recommend routes that minimize both delays and carbon footprint
- Autonomous vessel coordination: As autonomous ships begin pilot operations, predictive systems will need to coordinate machine-to-machine berth scheduling
The era of reactive port management is ending. Shippers who invest in predictive port congestion analytics today are building a structural advantage that will compound as the technology matures. The data is available, the models work, and the ROI is measurable — the only question is how quickly your organization will adopt.
Get Real-Time Port Congestion Data via API
FreightPulse delivers predictive congestion scores and dwell time estimates for 200+ ports worldwide.
Start Free — 100 calls/mo →